EasyInvoice - Bank Invoices
An Automated Bank Invoice Documents Management Using OCR & ML
Problem Definition
A banking company wanted a change to its outdated data management process, which was heavily reliant on physical documents, particularly PDF invoices and archived records. The existing system was file-driven, requiring manual handling and storage, which made it time-consuming, inefficient, and prone to errors. To address these challenges, the company aimed to transition to a more modern, data-driven approach. By automating the management of invoices and other documents, they hoped to streamline operations, improve data accessibility, and enhance overall efficiency. The ultimate goal was to transform their document handling system into one that leverages digital tools and analytics, enabling faster decision-making and reducing manual intervention.
Project Management
The project was managed using an Agile methodology, organised into three main phases: Data Collection and Analysis, Development Pipeline Design, and Development and Deployment. Each phase was divided into sprints, allowing for focused efforts on specific tasks and enabling iterative improvements based on feedback.
In Phase 1, requirements were gathered, data was explored, and a robust data model was designed. Phase 2 focused on building the development pipeline, which involved selecting relevant data, configuring the SkEYE Ingest™ module, and refining the process through testing. Finally, Phase 3 included the development of an interface for managing end-to-end registration and a real-time dashboard, culminating in system testing, documentation, and deployment. This structured, sprint-based approach can be summarised in the following gantt chart :
Data Understanding
In the initial phases of the project, the company did not properly collect all of the document images, so they provided us with sample images of various documents, including proforma invoices, final invoices, driving licenses, and citizen IDs. We had to build our processing pipeline based on these sample images, while also generalising to assume that all data would likely share similar low quality. This way, the model could effectively handle all types of documents we might encounter.
Later on, the complete dataset was sent by the company, but we wanted to ensure we fully understood the specific challenges we were dealing with. To facilitate this, we created a data dictionary tailored to the client’s banking terminology. This dictionary helped clarify the terms and concepts specific to their industry, allowing us to better address the nuances of the documents and improve our data extraction efforts.
Data Model
In this project, the data model is crucial for understanding what data is needed and how to gather and analyse it effectively. It helps combine data from different sources and ensures the information is accurate and reliable by setting clear rules. This model also makes it easier to retrieve data quickly, which is important for the real-time dashboard and reporting features. It serves as a common reference for everyone involved, improving communication and teamwork, and keeping everyone on the same page. Plus, its flexibility allows it to adapt to changing project needs in the future, making it a key part of the project’s success. Due to client data privacy protection , the actual data model attributes are not included , but the general idea can be summarised in the following diagram :
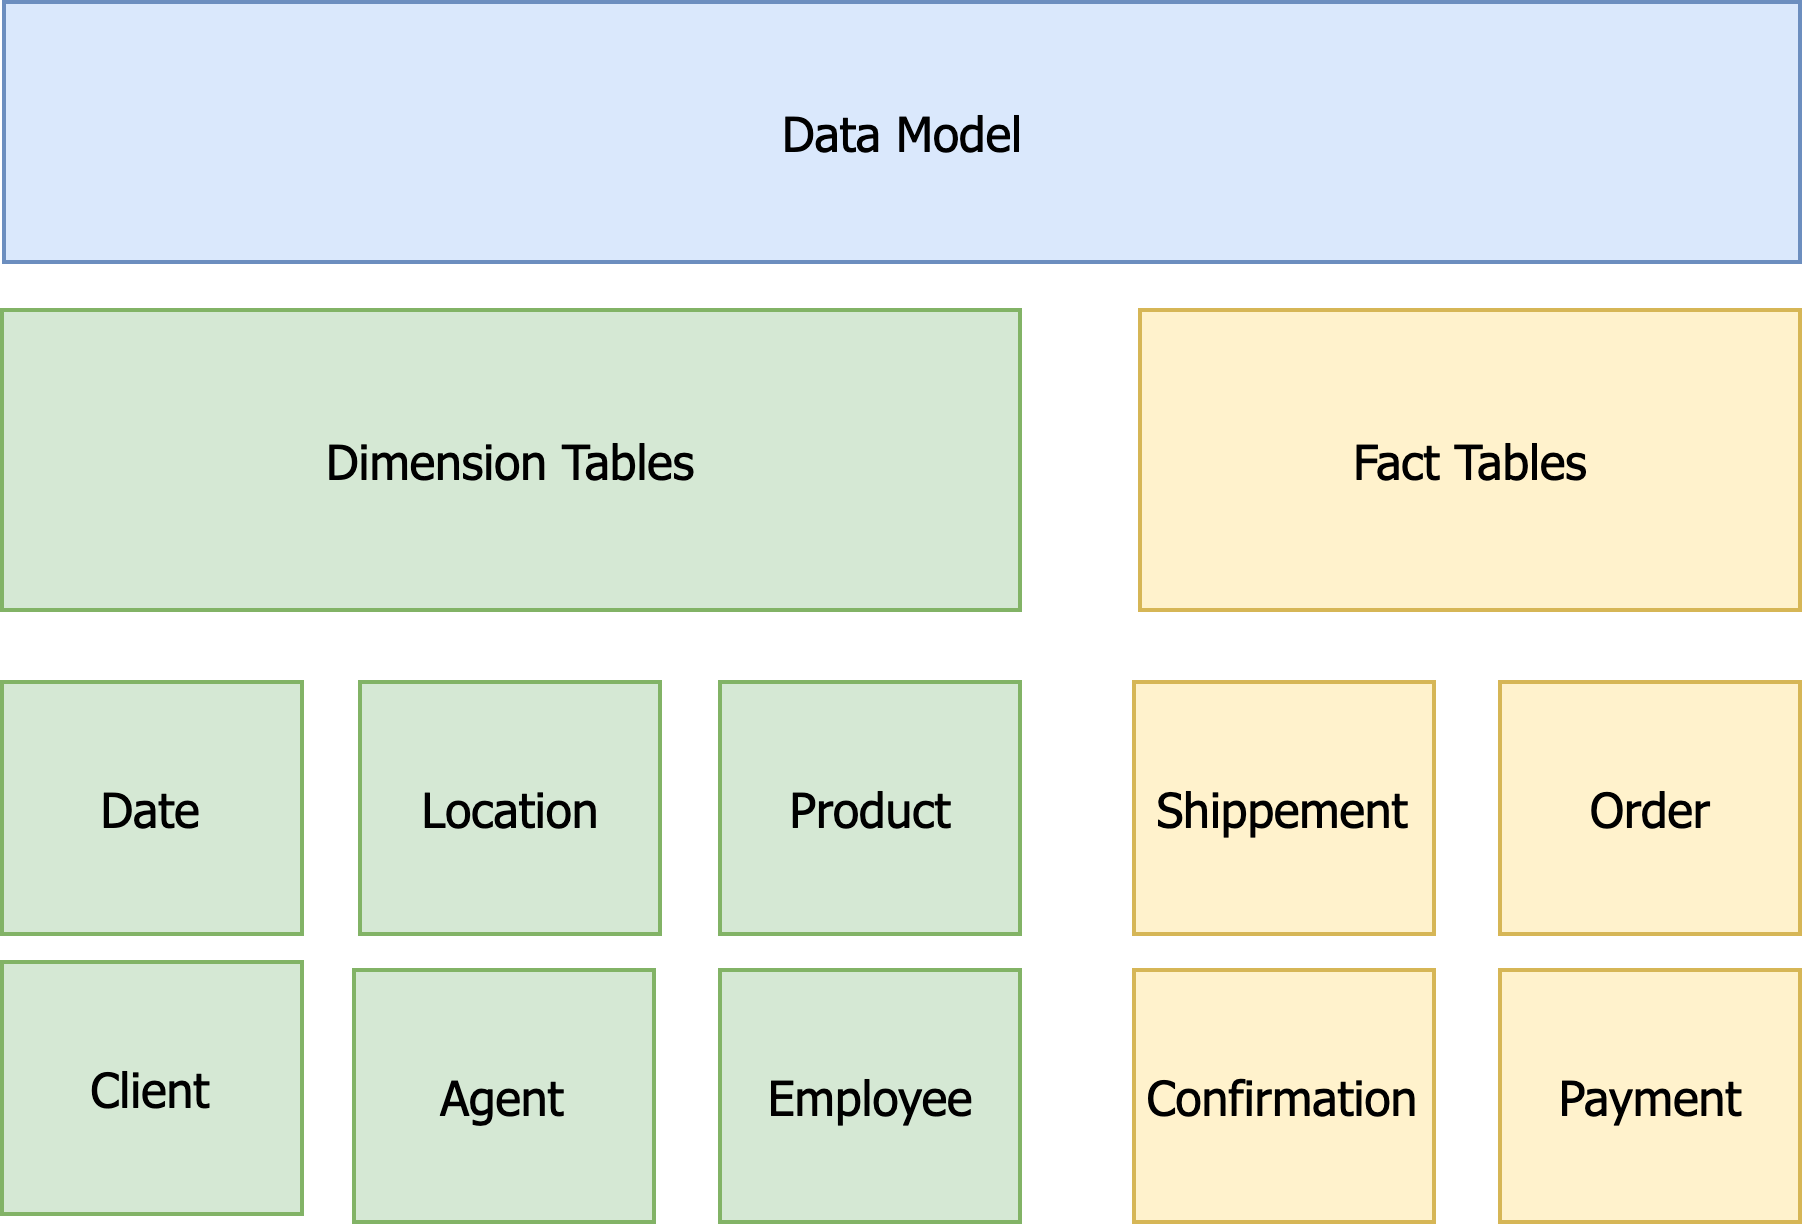
Dimension Tables
A dimension table is a part of a data model that holds descriptive information about the data, like categories or attributes. It helps provide context for the main data, making it easier to analyse things like sales by product, customer, or time.
| Dimension Table | Description |
|---|---|
| Date | Encompasses a comprehensive list of all feasible dates within a finite range, including day, month, quarter, and year. It serves as a reference for temporal data and facilitates date-based analysis and filtering. |
| Location | Stores a diverse range of possible locations, covering country, state, city, zip code, and specific addresses. It acts as a reference for spatial data, supporting location-based querying and analysis. |
| Product | Contains essential information about the bank's products, such as cars, motorbikes, or other offerings. It includes attributes like product name, category, description, and relevant details, aiding in product-related reporting and analysis. |
| Client | Stores comprehensive data pertaining to the bank's clients, including names, birth information, and other relevant characteristics. It serves as a reference for client-centric analysis and facilitates personalized services. |
| Agent | Holds crucial information related to the bank's agents or representatives, including names, birth information, and other relevant characteristics. It serves as a reference for agent-specific analysis and performance evaluation. |
| Employee | Encompasses vital details about the bank's employees, such as names, branch assignments, roles, departments, and other pertinent information. It acts as a reference for employee-related analysis and workforce management. |
Fact Tables
a fact table is the main table that holds measurable data or metrics, like sales amounts or quantities sold. It includes references to dimension tables, which provide context for understanding the facts, such as dates, products, or clients. Fact tables help users analyse and report on data from different angles.
| Fact Table | Description |
|---|---|
| Shipment | Stores information about the shipment process, including date, location, reference, sender, recipient, quantity, load details, and other relevant shipping data. |
| Order | Centralizes core details of orders, encompassing information about the order date, order ID, customer ID, product ID, quantity, unit price, total amount, delivery address, status, and other pertinent data for tracking and managing orders efficiently. |
| Validation | Contains essential information related to order confirmations, including date, confirmation details, status, recipient, and additional relevant data confirming the acceptance or completion of an order. |
| Payment | Stores crucial data regarding payment transactions, such as payment date, amount, payment method, currency, status, and other relevant details related to processing and completing payments for orders or services. |
Relations
In a data model, relations connects the different data model tables, meaning fact tables to dimension tables and vice versa. They are essential for maintaining data integrity, making queries easier, and providing context, helping to organise and analyse data effectively.
- All fact tables implying or related to the Client will be connected to its dimension table.
- All fact tables implying or related to the Employee will be connected to its dimension table.
- All fact tables implying or related to the Agent will be connected to its table.
- All fact tables will be connected to the Date and Location dimension tables.
- All fact tables will be connected to the Product dimension table.
Data Issues:
The issue with these bank invoices is that many of the PDFs and image documents are of very poor quality. Some are scans of physical documents, while others are just pictures taken with a phone. As a result, most of these PDFs are not digitally encoded text but rather images embedded in a PDF format. This makes it difficult to extract and work with the information contained in them.
Additionally, the invoices are often not monolingual, with a mix of French and Arabic, which adds to the complexity. The structure of the invoices can also be problematic, as they often contain a combination of tables and text, making it hard to identify key data points. This combination of poor quality and mixed languages complicates the processing and analysis of the invoices, creating significant challenges for anyone trying to manage or extract useful information from them.
Suggested Solutions:
This project faced multiple challenges related to the documents and the overall processing workflow. Each document had its own issues, such as poor image quality and inconsistent formats, complicating data extraction. To address these, we developed a pipeline that tackled each problem individually and then integrated the solutions into a cohesive automated process.
This final pipeline was transformed into a data product delivered to the client, a banking company. The following sections will outline the specific solutions we implemented for each challenge encountered during processing, as well as an overview of the final pipeline, demonstrating how our structured approach improved data extraction efficiency and met the client’s needs.
Solution to Data Format:
To extract data from the images, we needed OCR (Optical Character Recognition) techniques that could pull text from these visual formats. Several OCR tools were tested, including PaddleOCR, Tesseract OCR, EasyOCR, and Keras OCR, each delivering different levels of success. Some tools, like Tesseract, stood out for their multilingual support, making them useful for handling the invoices that mixed French and Arabic. Others, like EasyOCR, provided better overall accuracy in extracting clean text, but often lacked robust language support. Each tool had its strengths, but none provided a perfect solution, so testing and refining were necessary to find the best fit for our specific needs.
| OCR Model | Advantages | Disadvantages |
|---|---|---|
| PaddleOCR | PaddleOCR supports multiple languages, offers a user-friendly interface, and works on all major platforms. It handles complex document layouts effectively. | It requires technical expertise for setup, has limited community support, and slightly lower accuracy compared to other models. |
| Keras-OCR | Keras-OCR leverages deep learning for high accuracy, supports many languages, and has a flexible, well-documented structure with strong community backing. | It has high resource demands, limited support for complex layouts, and often needs pre-processing to perform optimally. |
| EasyOCR | EasyOCR supports over 100 languages, is quick to deploy with pre-trained models, and processes various document types efficiently. | It offers limited customization, has lower accuracy on low-quality inputs, and lacks the advanced features of specialized OCR tools. |
| Pytesseract | Pytesseract integrates easily into Python, supports over 100 languages, and is well-documented with a large user community, providing good accuracy for general OCR tasks. | It struggles with complex layouts, lacks table extraction functionality, and may need pre-processing for better results. |
Solution to Watermarks:
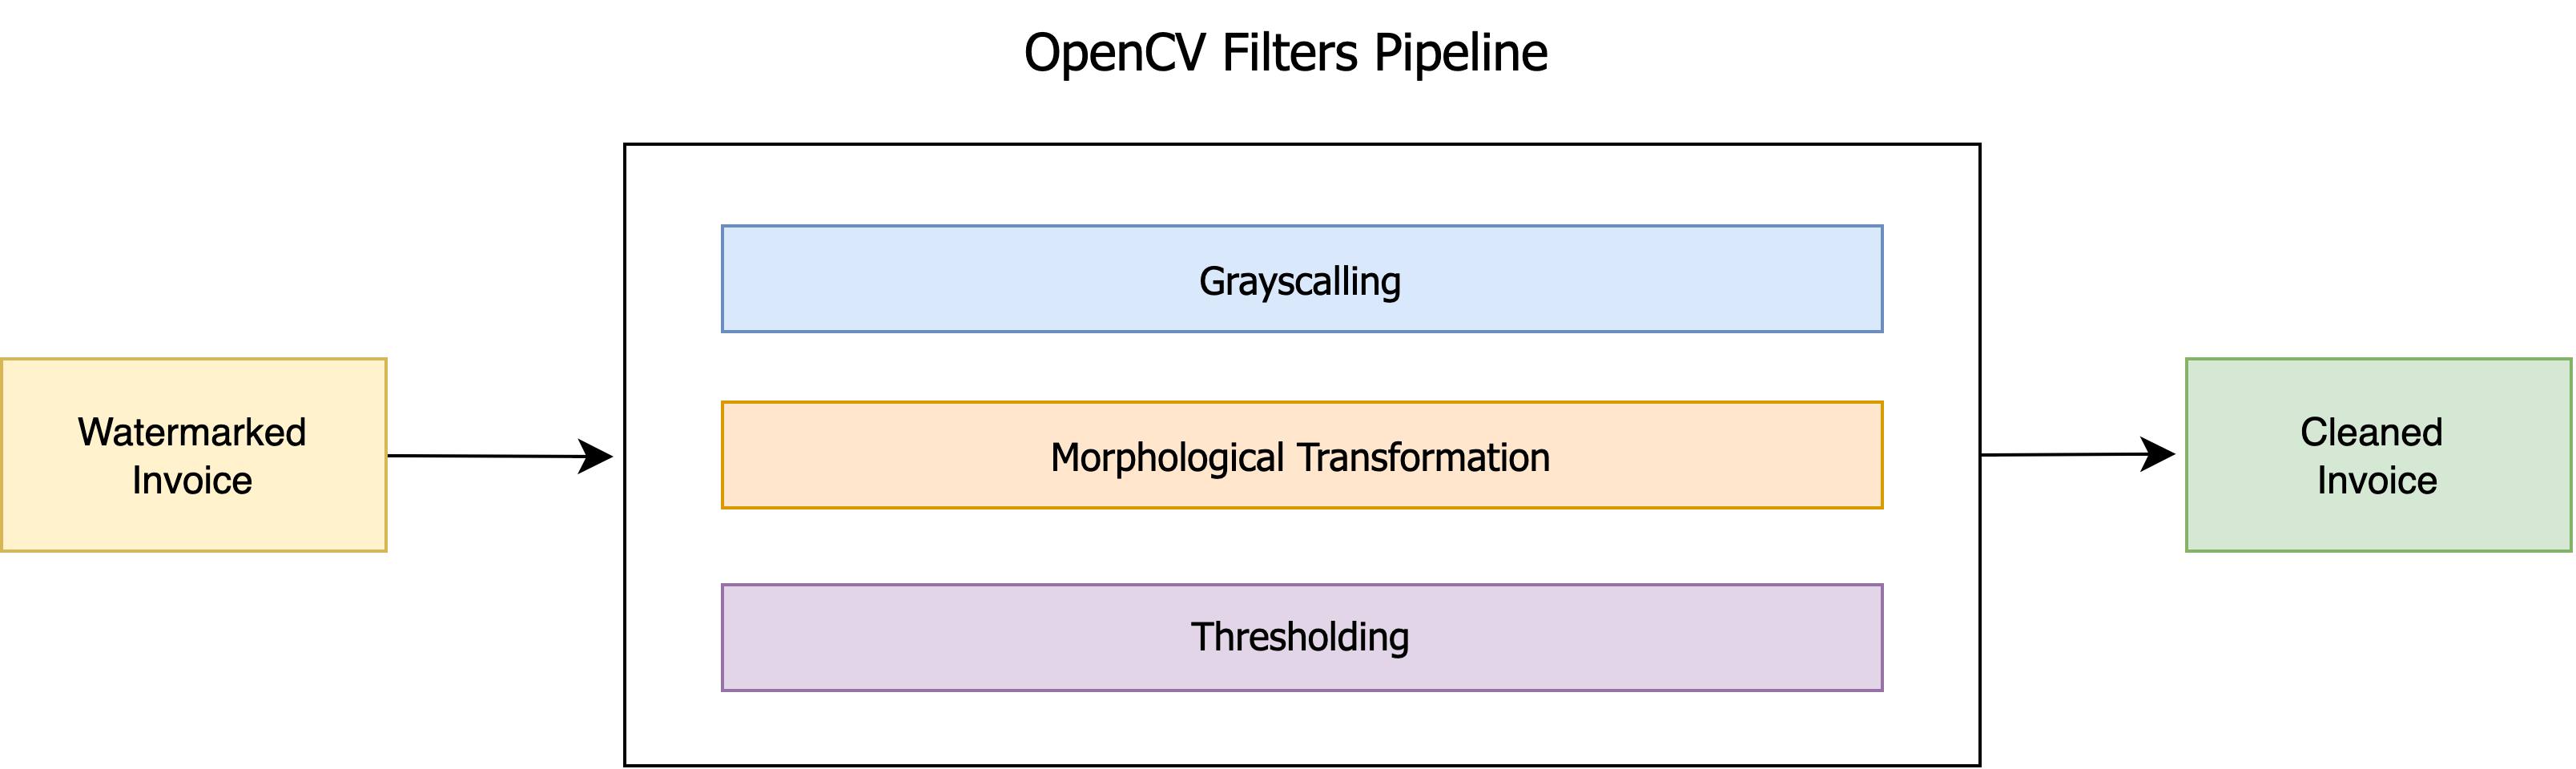
Since many of the invoices were images, some had client watermarks that interfered with the text, making extraction less accurate and causing the formatting to break. The watermarks often blended with the text, making it hard for OCR tools to differentiate between the two. To fix this, we used OpenCV (cv2) and built a processing pipeline to clean up the images before extracting text. This included converting the images to grayscale, applying morphological transformations to highlight the text, and using thresholding to separate the text from the background. Finally, we replaced the dark pixels of the watermarks with white to eliminate them without affecting the actual text. This preprocessing greatly improved the accuracy and formatting of the extracted data.
Solution to Table Extraction:
Some OCR tools were able to extract the text properly, but we ran into significant issues due to the unusual format of the invoice tables. The tables often had complex layouts, which standard OCR tools struggled with. This led us to focus on specialised OCR tools specifically designed for table extraction, such as image2table (Tesseract), PYPDF2, Camelot, and Table Transformer.
We also tested machine learning models built for table recognition and extraction, like TableNet, and even tried software solutions such as Tabula. To further improve the accuracy of table extraction, we applied OpenCV to crop the table area from the invoice image—usually found in the center—before processing. This helped reduce noise from other parts of the document and allowed for more precise extraction of the data from the tables.
| Tool | Advantages | Disadvantages |
|---|---|---|
| Camelot | Camelot is specifically designed for table extraction from PDFs and images, supports various table formats, and offers reliable parsing. It provides both a command-line interface and Python library, working well with PDF and image files. | Its functionality is limited to table extraction, struggles with complex table layouts, and lacks OCR capabilities for text outside tables. |
| Img2table | Img2table excels at table extraction from images, supports multiple image formats, and provides a simple API with good accuracy for common layouts. It works well with clean and well-defined tables. | It has limited support for complex or nested tables, struggles with noisy or low-quality images, and lacks OCR capabilities for non-table text. |
| PyPDF2 | PyPDF2 is a versatile library for handling PDF files, offering text, image, and metadata extraction, encryption, and document manipulation features. It supports both Python 2 and 3. | It has limited OCR functionality, relies on external OCR libraries, and is less accurate for OCR tasks like table extraction. |
| Table Transformer | Table Transformer uses deep learning for accurate table extraction, supports both structured and unstructured tables, and allows fine-grained control over extraction. It handles various table formats effectively. | It requires advanced technical skills, has limited pre-trained models and documentation, and demands high computational resources. |
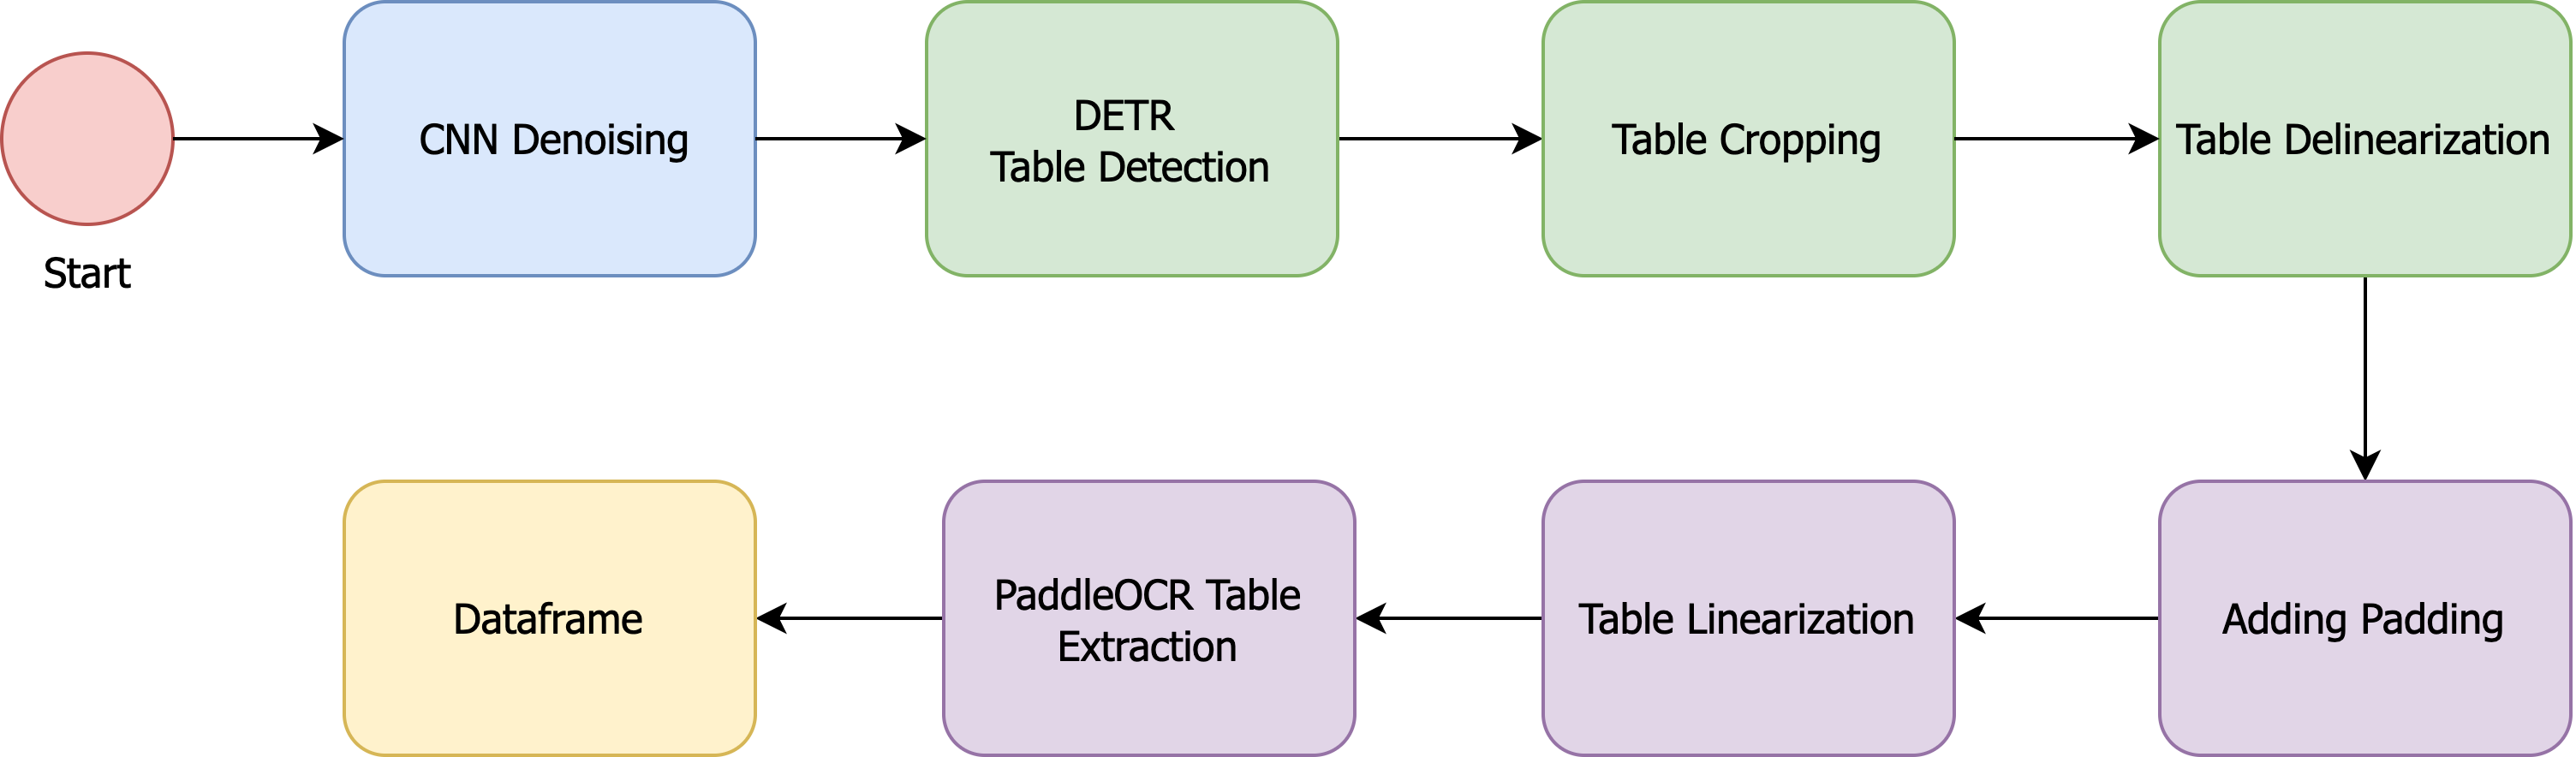
The finale pipeline for the process of extracting tables from documents, particularly those that are primarily images, involves several key steps designed to enhance the quality of the data we extract. The first stage in this pipeline is preprocessing, where we apply CNN denoising techniques to clean up the images. This helps to remove noise and improve the overall clarity, making the subsequent steps more effective.
Once the images are denoised, we move on to DETR Table Detection. This step utilizes advanced detection models to identify the areas within the images that contain tables. By accurately locating these areas, we ensure that we focus our efforts only on the relevant parts of the document.
Following detection, we proceed with Table Cropping. This involves extracting the identified table regions from the images, isolating them for further processing. Once the tables are cropped, we perform Table Delinearization to address any crooked lines or irregularities that often occur in scanned images. Many tables in these documents are skewed or misaligned due to the way they were captured, and fixing these crooked lines is crucial for accurate data extraction.
To enhance the visual structure of the tables, we then add Padding around the table edges. This padding helps to create a clear boundary between the table and the surrounding content, which can be beneficial for both visualization and subsequent processing. Next, we engage in Table Linearization, where we apply techniques to draw better-defined lines that delineate the rows and columns of the table. This step is essential for ensuring that the table’s structure is preserved and that the extracted data can be accurately interpreted.
Finally, we arrive at the extraction phase with PaddleOCR Table Extraction. This advanced OCR tool is specifically designed to handle structured data, allowing us to convert the cleaned and well-defined table images into a structured format, such as a DataFrame. This structured format is crucial for further analysis, enabling us to work with the extracted data in a way that is both organized and easily accessible.
Overall, this comprehensive pipeline not only improves the accuracy of our table extraction but also enhances the quality of the data we provide, ensuring that it meets the needs of our analysis and reporting processes.
Solution to Image Quality:
Since the data was primarily in the form of images embedded within PDFs, and often of poor quality, this made data extraction—whether for tables or text—particularly challenging. The poor image quality, including blurriness and noise, significantly affected the accuracy of the extraction process. To address this, the documents first had to be cleaned and enhanced to improve their readability.
Various methods were tested to achieve this, including experimenting with D-GAN (Denoising Generative Adversarial Networks), RCNN (Region-based Convolutional Neural Networks), and CNN autoencoders. These techniques were aimed at reducing noise and enhancing the clarity of the images, making it easier to extract the necessary data from both tables and text sections. By improving the quality of the documents beforehand, the goal was to ensure more accurate and reliable data extraction, regardless of the initial state of the invoice.
Solution Named Entity Issue:
Since these documents are invoices, they share a similar format, which means they have the same attributes but different values that change based on client and product information. One suggested solution was to use weak labels, employing regex expressions to extract the values based on these attributes and then transforming the results into JSON files. However, this approach was ultimately set aside because the attributes were inconsistent across the various documents, making it unsustainable and likely to fail if a new invoice format was introduced.
Instead, another solution was proposed: leveraging Large Language Models (LLMs) to extract these values. This could be done using a Question/Answering approach to retrieve specific data or by crafting a targeted prompt that would return all the information in a structured format. This method offers a more flexible and robust way to handle the variability in the invoices while ensuring accurate data extraction.
Final Pipeline:
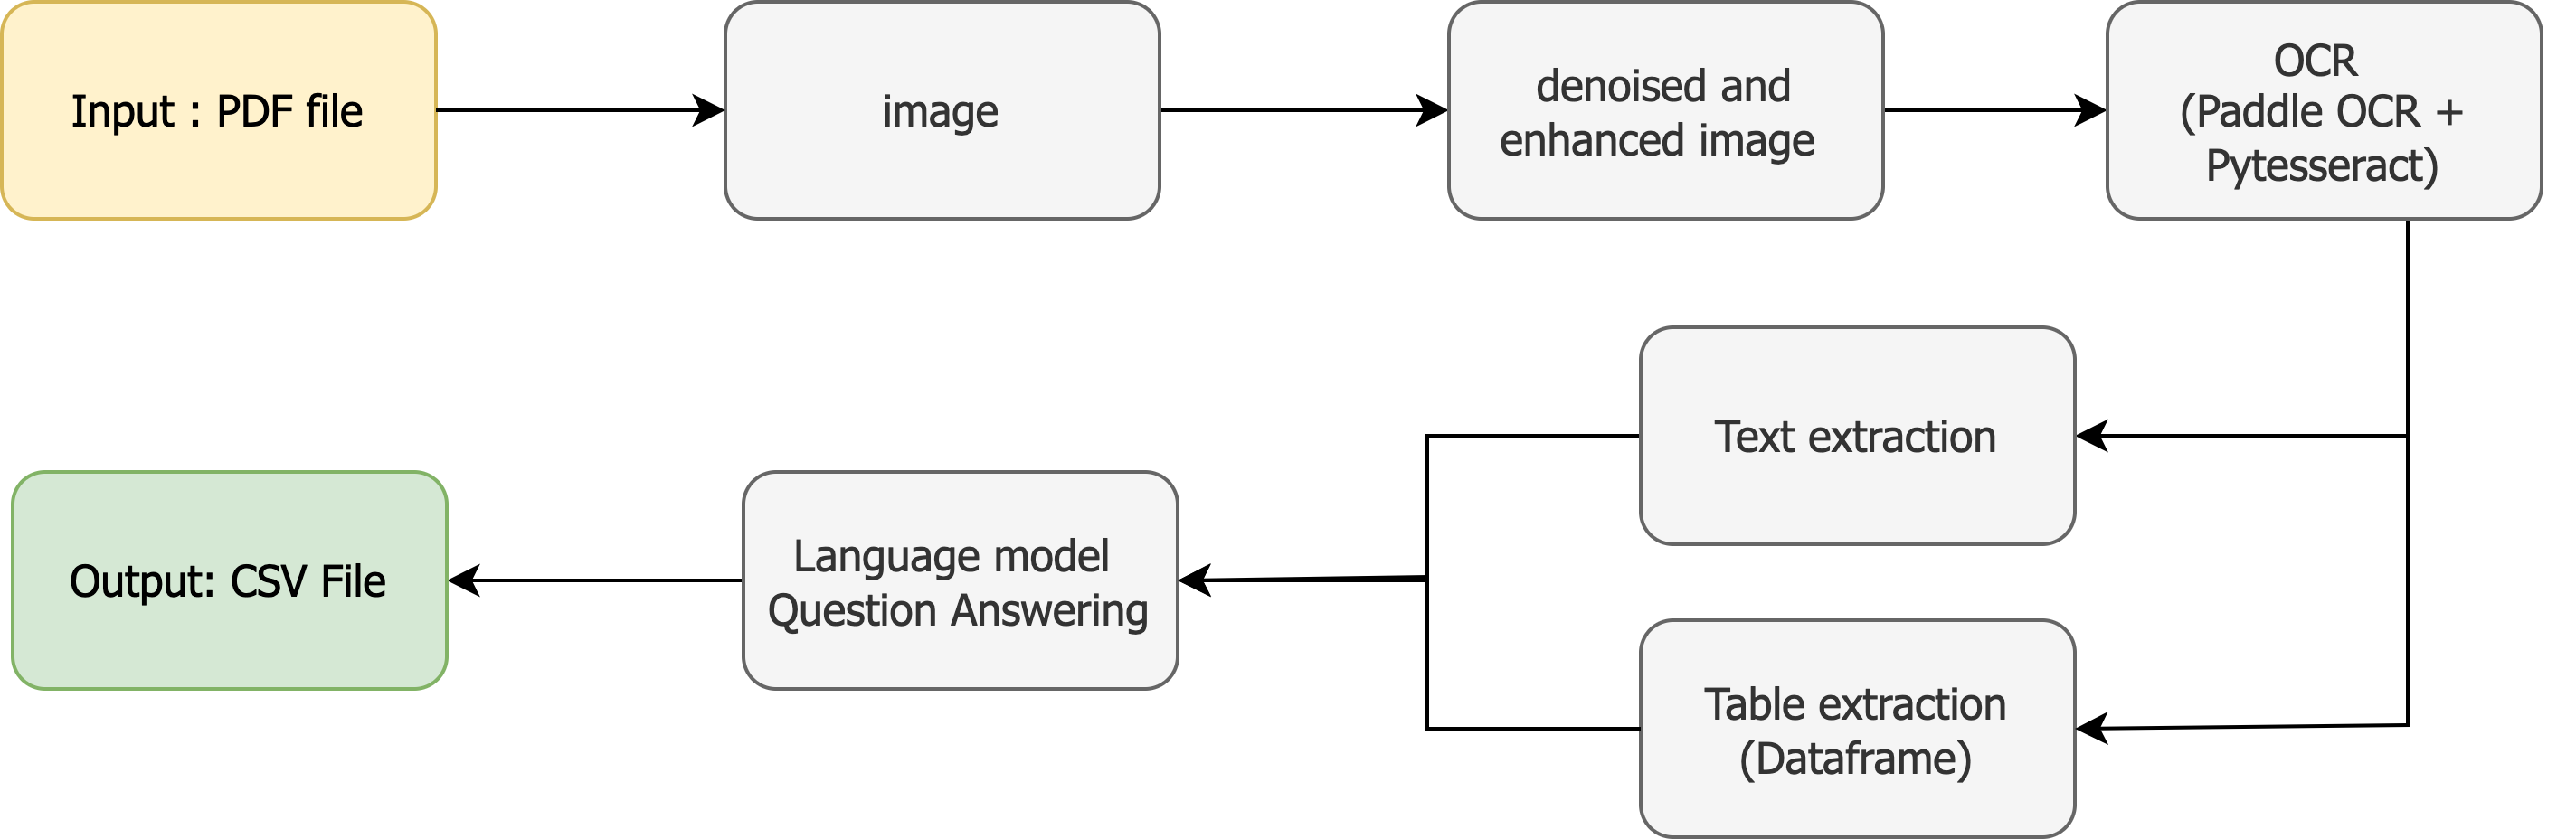
The final pipeline followed a series of well-defined steps to ensure accurate extraction and analysis of information from PDF files. First, we converted the PDF documents into high-quality images. This transformation was crucial for enabling the subsequent steps. Once the PDFs were converted, we applied image denoising and quality enhancement techniques to improve the clarity and readability of the images, which directly contributed to better results during text extraction.
For extracting the text, we used a hybrid approach. PaddleOCR was employed to recognize and extract standard text from the images, while PyTesseract was utilized specifically for detecting and extracting tables. By handling tables separately, we ensured the structure and data within them were preserved and accurately captured.
The extracted text files were then passed to a language model trained for question-answering tasks. This model processed the data, identifying key attributes and their corresponding values. The output was formatted into CSV files, making it easy to work with the extracted information for further analysis or reporting. This method not only optimized the extraction process but also improved the accuracy and organization of the data.